


What are the Fibonacci levels?
First, let’s begin from the beginning – Fibonacci numbers.
The Fibonacci numbers are a sequence of numbers where each number is the sum of the previous two numbers.
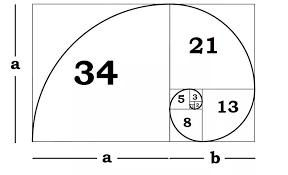
Fibonacci sequence: 0, 1, 1, 2, 3, 5, 8, 13, 21, 34, 55, 89, 144, 233, 377, etc.
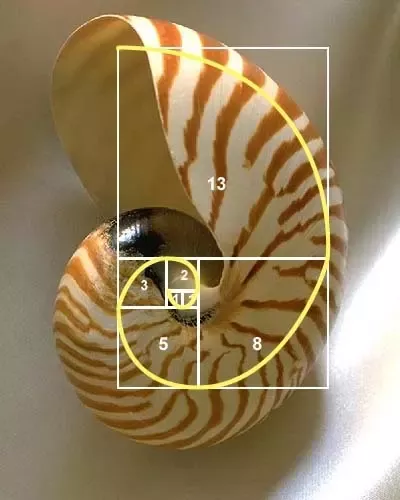
Eventually, people began to observe these numbers occurring in nature, such as the number of flower petals and the structure of tree branches. The numbers became even more interesting when mathematicians found the golden ratio (1.618) occurring in the sequence after the first few numbers.
Golden ratio in Fibonacci sequence: 21/34 = 0.618, 34/55 = 0.618, 55/89 = 0.618 or 61.8%…
It didn’t take long for people to begin exploring different directions of divisions and multiplications, searching for connections between the Fibonacci sequence and other ratios.
13/55 = 0.236, 34/89 = 0.382, … 377/233 = 1.618, etc.
If it occurs in nature, why not in trading charts, right?
 The idea of identifying significant ratios that predict future price action certainly gained popularity, causing financial market traders to rely on Fibonacci numbers. These significant ratios became the Fibonacci levels traders use to plot reversals and price targets for financial instruments.
As far as superstitions (or science?) go, many traders believe these ratios, usually expressed as percentages, to have relevance in the financial market and buy and sell at the Fibonacci levels to make them self-fulfilling and effective indicators. The Fibonacci levels traders use in technical analysis are the Fibonacci retracements and extension levels.
What are Fibonacci retracement levels?
Fibonacci retracement levels are the significant ratios that indicate where an asset’s price movement may pull back or stall.
Fibonacci retracement levels: 0.236, 0.382, 0.500, 0.618, 0.764, 1.00, 1.382, 1.618
Traders use the retracement levels when:
- An asset’s price in an uptrend reaches a new high; or
- A new low when it’s in a downtrend.
The idea is that the new high or new low is only a temporary end to the trend, and there will be a market correction or reversal at these Fibonacci retracement levels. For example, if a stock price rises to $10 and then drops $6.18, it is said to have retraced 61.8%, a Fibonacci number. Although 0.500 or 50% and 1.000 or 100% are not exactly Fibonacci numbers, traders use them as a support and resistance indicator.
What are Fibonacci extension levels?
Fibonacci extension levels are the significant ratios that show where an asset’s price may go next after a retracement or pullback. They are also possible zones where price may reverse because many traders set profit targets at these levels.
Fibonacci extension levels: 0, 0.382, 0.618, 1.000, 1.382, 1.618, 2.000, 2.618
These levels are employed to an asset’s price that is anticipated to continue an uptrend or downtrend to make new highs or lows. The first two fib extensions ratios, 0 and 0.382 (or 38.2%), are not commonly used in plotting extension levels.
How to calculate Fibonacci retracement and extension levels? Fibonacci formula
In an uptrend or bullish market, the formulas to calculate Fibonacci retracement and extension levels are:
UR = H - ((H-L) × percentage); and
UE = H + ((H-L) × percentage).
While, the formula for the calculations in a downtrend or bearish market are:
DR = L + ((H-L) × percentage); and
DE = L - ((H-L) × percentage),
where:
H– High;L– Low;UR– Uptrend Retracement;UE– Uptrend Extention;DR– Downtrend Retracement; andDE– Downtrend Extention.
When you apply the Fibonacci retracement to a price chart, you pick two price points – a high and a low. .
For instance, suppose the price of a crypto coin rises from $10 to $13.82, and these two price levels are the points used to plot the retracement indicator:
The 0.236 or 23.6% uptrend retracement level equals:
$13.82 - (($13.82 - $10) × 0.236) = $12.92.
How to use Fibonacci levels in trading?
Importance of Fibonacci levels
Fibonacci levels are important because a lot of traders use them. Therefore, if you are using them, it is wise to keep these points in mind:
- Fibonacci levels are reliable in identifying support and resistance levels where other technical analysis indicators are not applicable.
- While pivot points are best regarded as price zones and moving averages change with price action, Fibonacci retracement levels are fixed prices based on the price points. Once these prices get tested, they usually get accompanied by a price reversal or break.
- Because of the nature of Fibonacci retracements and extension prices, you can use them to decide when to enter or exit a trade. Assuming a stock price is in a downtrend and it retraces to the 50% level, which is a support level, you can decide to buy the stock in anticipation of a change in price trajectory with a price target at the 76.4% level or take profits at the 61.8% level.
- You can plot Fibonacci retracement and extension levels for any two price points in any timeframe in any market.
Limitations of Fibonacci retracement and extension levels
The limitations of Fibonacci levels are as follows:
- Like any other technical analysis indicator, Fibonacci retracement levels are not failproof pointers for price movement. Using them is best when in combination with other indicators.
- The Fibonacci levels are many and far apart, making it challenging to predict the exact price of a reversal or breakout.
FAQs
What is Fibonacci retracement?
Fibonacci retracement is the level on a price chart where the price trajectory is expected to a pullback or stall in its trend. The Fibonacci retracement numbers are based on the following ratios: 0.236, 0.382, 0.500, 0.618, 0.764, 1.00, 1.382, 1.618.
How do you calculate Fibonacci retracement levels?
You can calculate the Fibonacci retracement levels using the formulas:
UR = High price - ((High price - Low price) × percentage)in an uptrend market; orUR = Low price + ((High price - Low price) × percentage)in a downtrend market,where:URis the uptrend retracement;DRis the downtrend retracement; andpercentagecan be any of the Fibonacci retracement levels: 23.6%, 38.2%, 50%, 61.8%, 76.4%, 100%, 138.2%, or 161.8%.
How do I trade with Fibonacci retracement and extension levels?
Once you understand how to read Fibonacci retracement and calculate the Fibonacci retracement numbers, you can:
- Use them to stop losses when going long or short on an asset;
- The fib extension values will help you determine the areas to set price targets and take profit orders; and
- It is always wise to take profits along and before the prices computed with the Fibonacci retracement prediction because there are no guarantees a rally will always get to the price targets.