|
Monday, March 9th., 2009 - Special
Report
The Big
"Bull/Bear" Picture ...
Investors need models of
various time periods to trade the markets.
While most investors look at daily and
intra-day charts, most avoid focusing on the
longer term.
While the markets will
fluctuate on a daily and weekly basis, we find
that 'Monthly" charts give the best picture of
when a Bull market starts and ends.
It is also the best time
period for tracking Bear Markets. Not knowing
when a Bear market starts and ends can
financially hurt investors and wreck havoc on
their retirement plans.
Today, we will share our Long
Term Bull/Bear Market Model. (It is posted
every day on our paid subscriber sites and
updated weekly.)
The Long Term
Bull/Bear Model for the S&P 500 ...
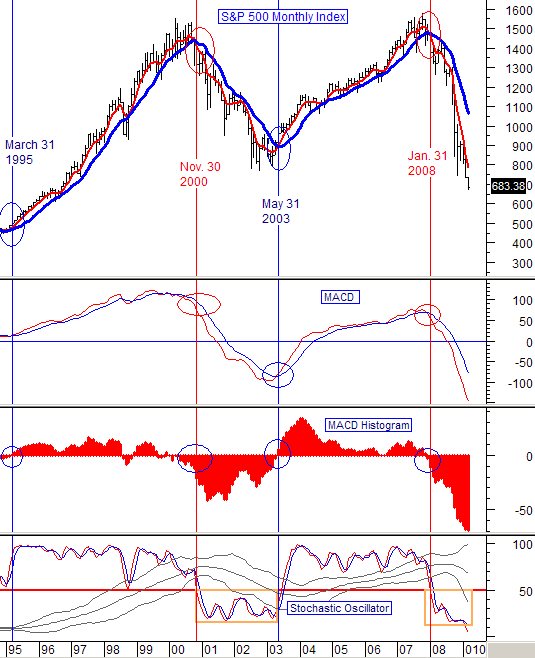
This is a monthly chart for
S&P 500. To signal changes in Bull and Bear
Market conditions, we use 3 indicators: The
MACD, a MACD Histogram, and a Stochastic
Oscillator.
What signals has the
Bull/Bear Model given?
First, on March 31, 1995,
the Model gave the signal for a New Bull
Market. That signal lasted until November 20,
2000 when it became time to exit.
And then, On November 20th.
2000, that was the signal for a new Bear
Market. That Bear Market lasted until May
31st. 2003, at which time our Model signaled
that it was time to exit the Bear Market.
The beginning of our last
Bull Market was therefore signaled on May
31st. 2003. That Bull Market remained in
force until January 31st. 2008 when a down
signal was triggered.
That brings us to where we
are now. The current Bear Market on this
model started in January of LAST year. You
don't have to be a rocket scientist to look at
today's chart and see that we are still in a
Bear Market.
While this model explores
the long term, there are weekly and daily
fluctuations in the market. Typically, a Bear
Market will have 4 to 5 instances where the
S&P will move above our red trend line. That
has only happened twice so far. The last
occurrence was last September. So it has now
been 6 months since we have seen the monthly
bars rise above the red trend line.
From a weekly or daily
perspective, these periods can give some nice
upside trades. As of last Friday, the
monthly Stochastic Oscillator showed a
very oversold condition. With that
condition, it shouldn't be too long before we
see a Bear Market rally. Remember that this
is a monthly chart that we update weekly ....
not a daily chart.
*****Click on this link to
get a short instructional video on the
indicators and settings that we use:
http://www.stocktiming.net/. On that
page, click on Seminar
#1-How to Predict a Bull or Bear Market.
*** Feel free to share
this page with others by using the "Send this
Page to a Friend" link below.
_________________________________________________
Do you have a
friend or fellow investor that you think
would appreciate receiving a link to this
page of Today's Analysis"?
If so, simply click on the link below
to quickly and easily forward an email
link. It is completely private, so we
won't even know if you send one.
Send This Page To a Friend
|